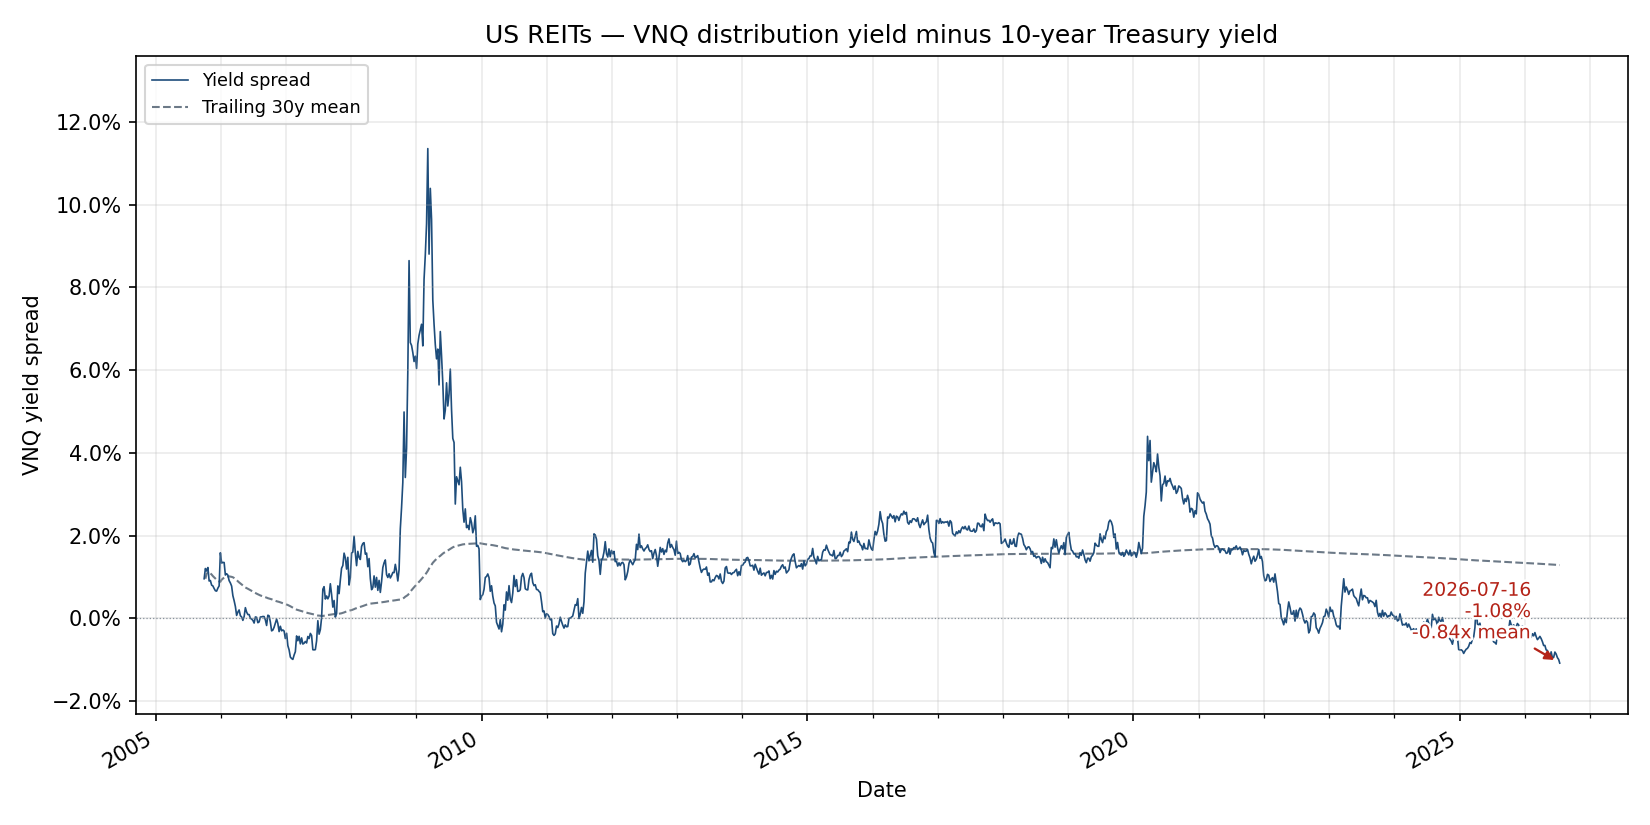
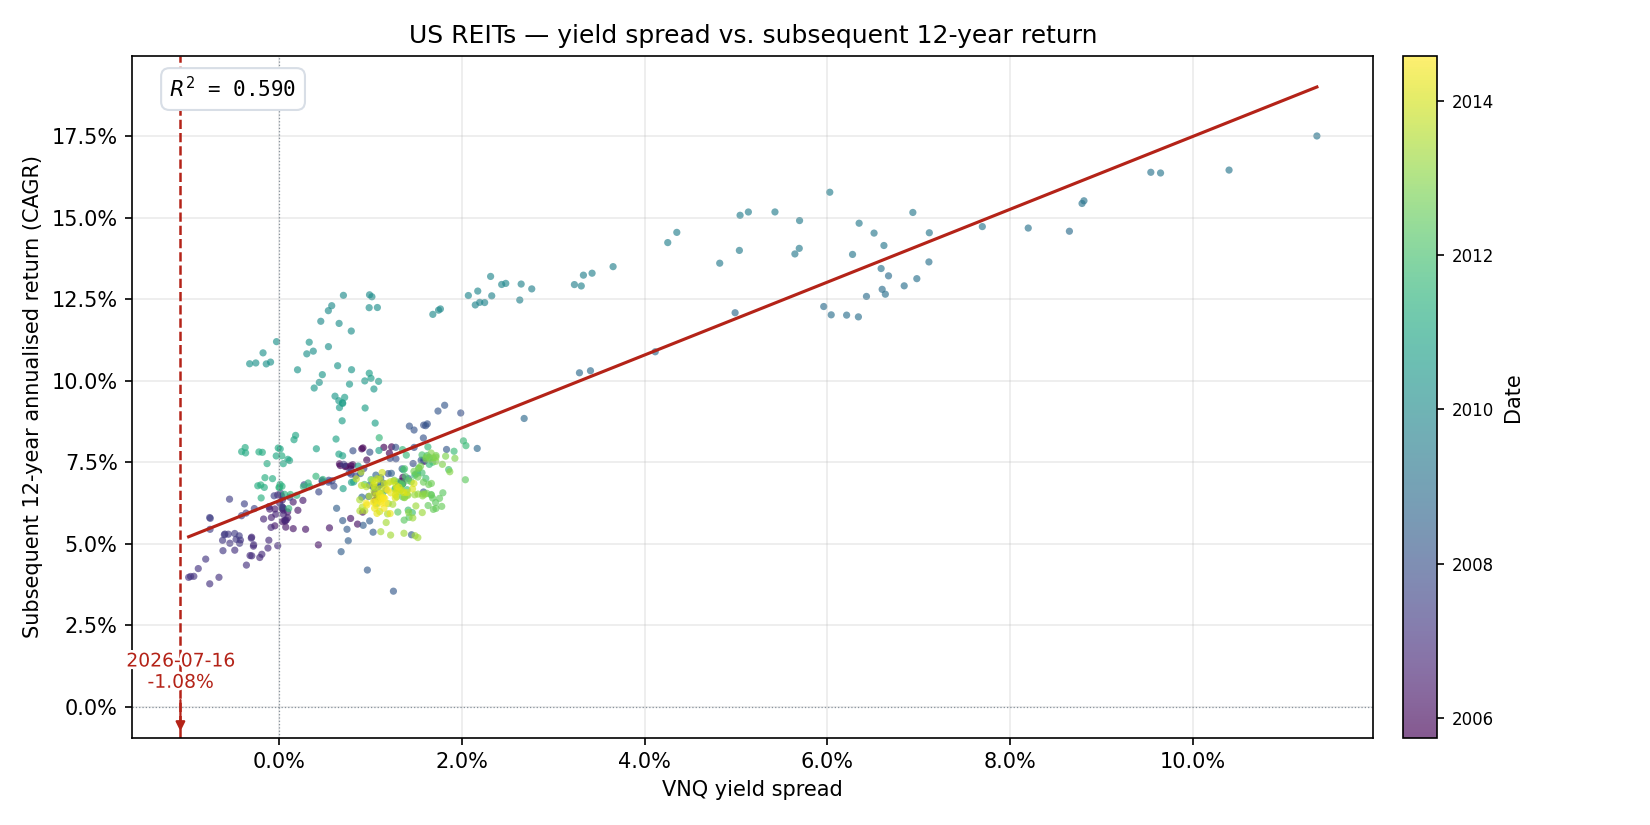
Weekly VNQ trailing 12-month distribution yield minus the 10-year Treasury yield, plotted against subsequent 12-year annualised VNQ returns. The red line on the scatter plot is the linear fit used for the Forecasts page.
US REITs — VNQ
Loading latest spread…