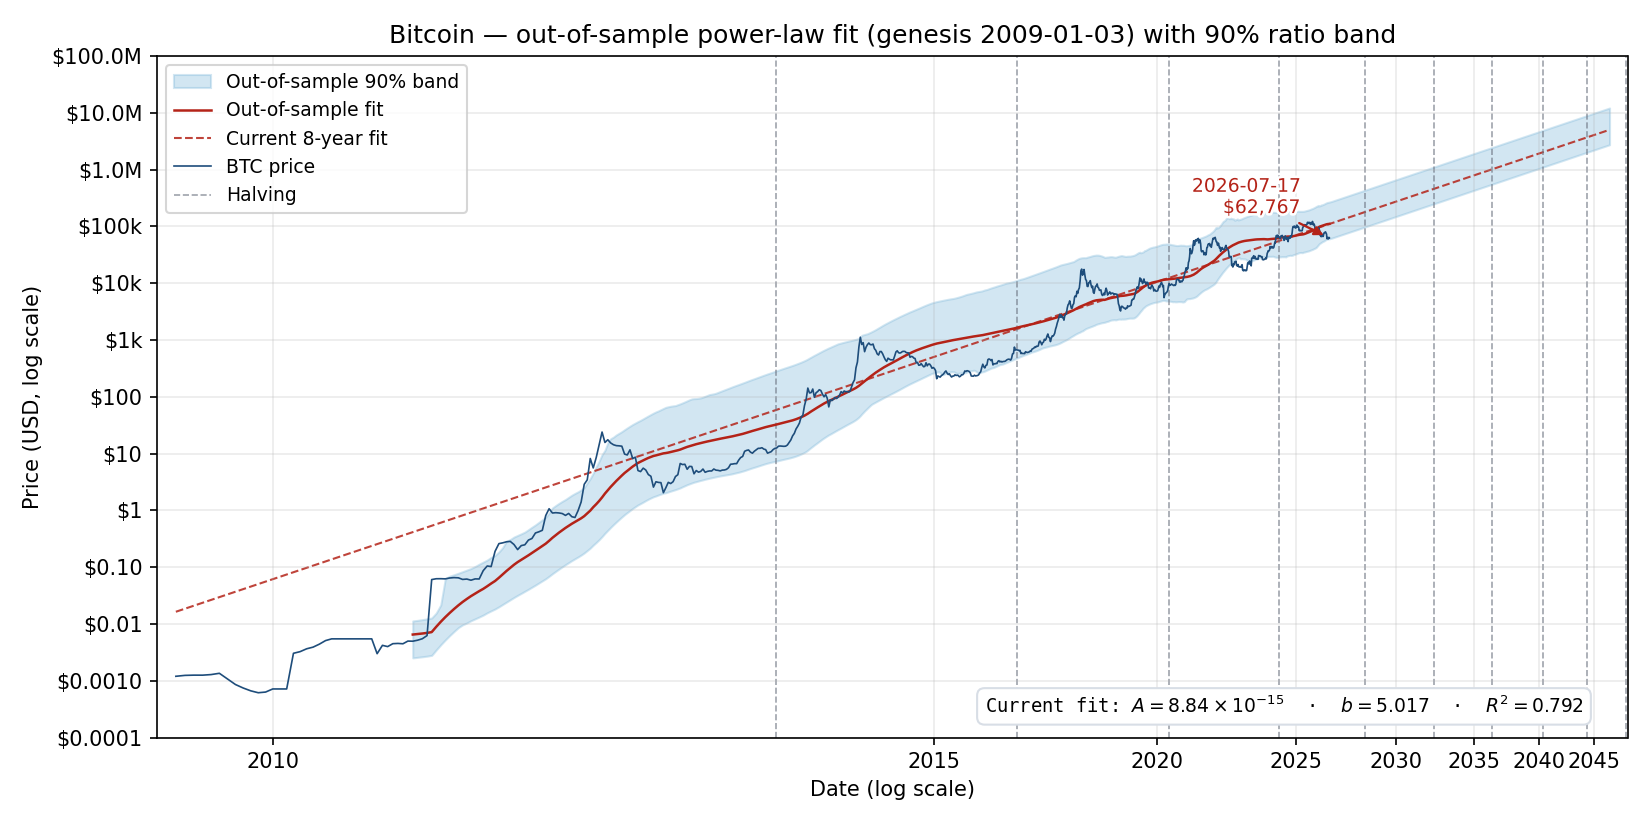
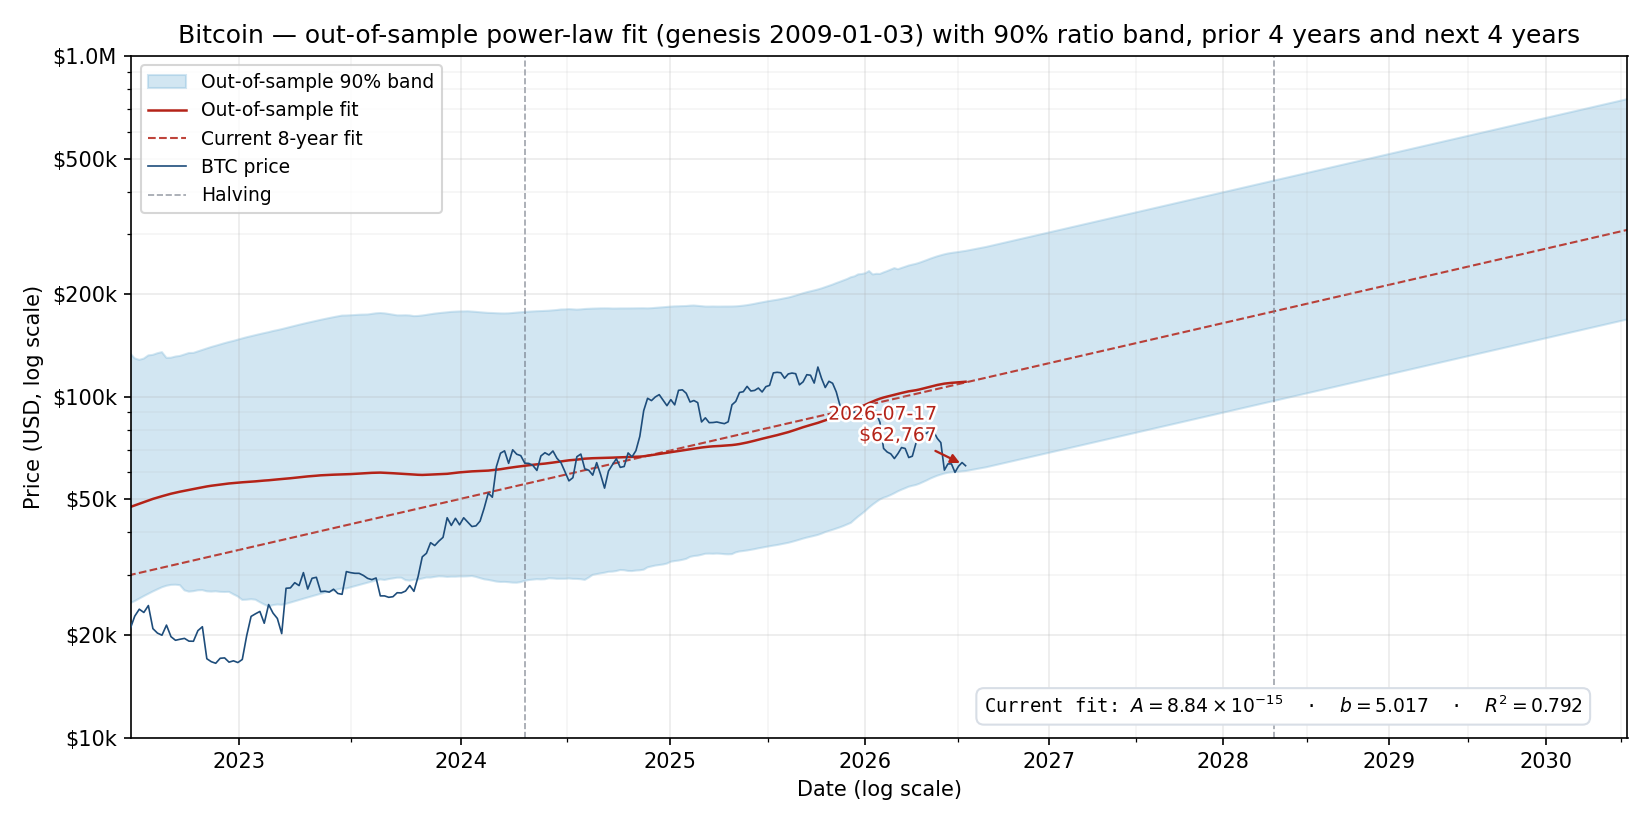
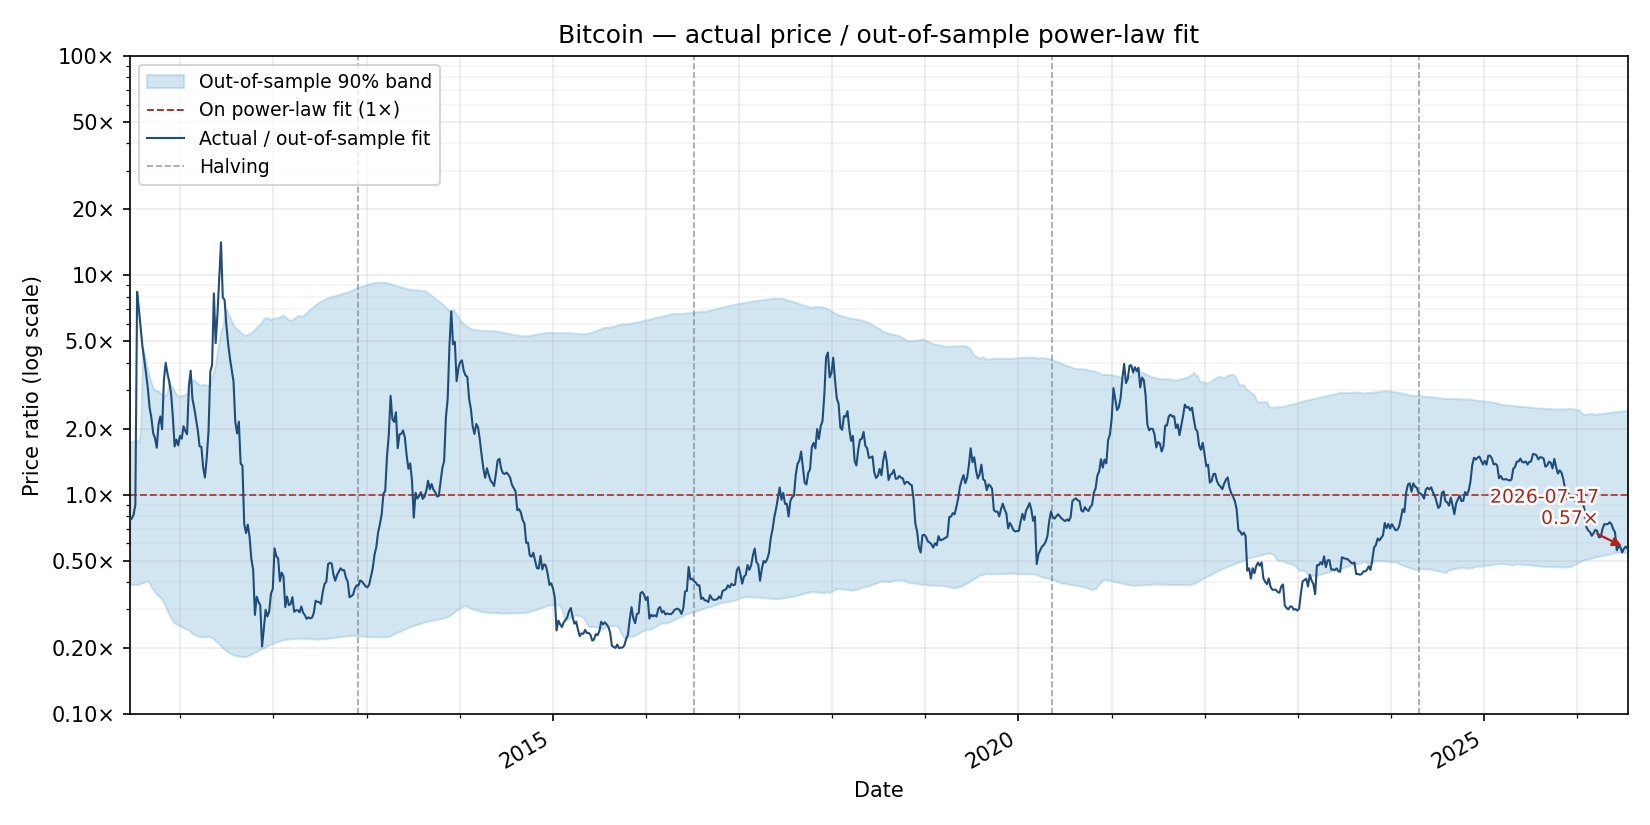
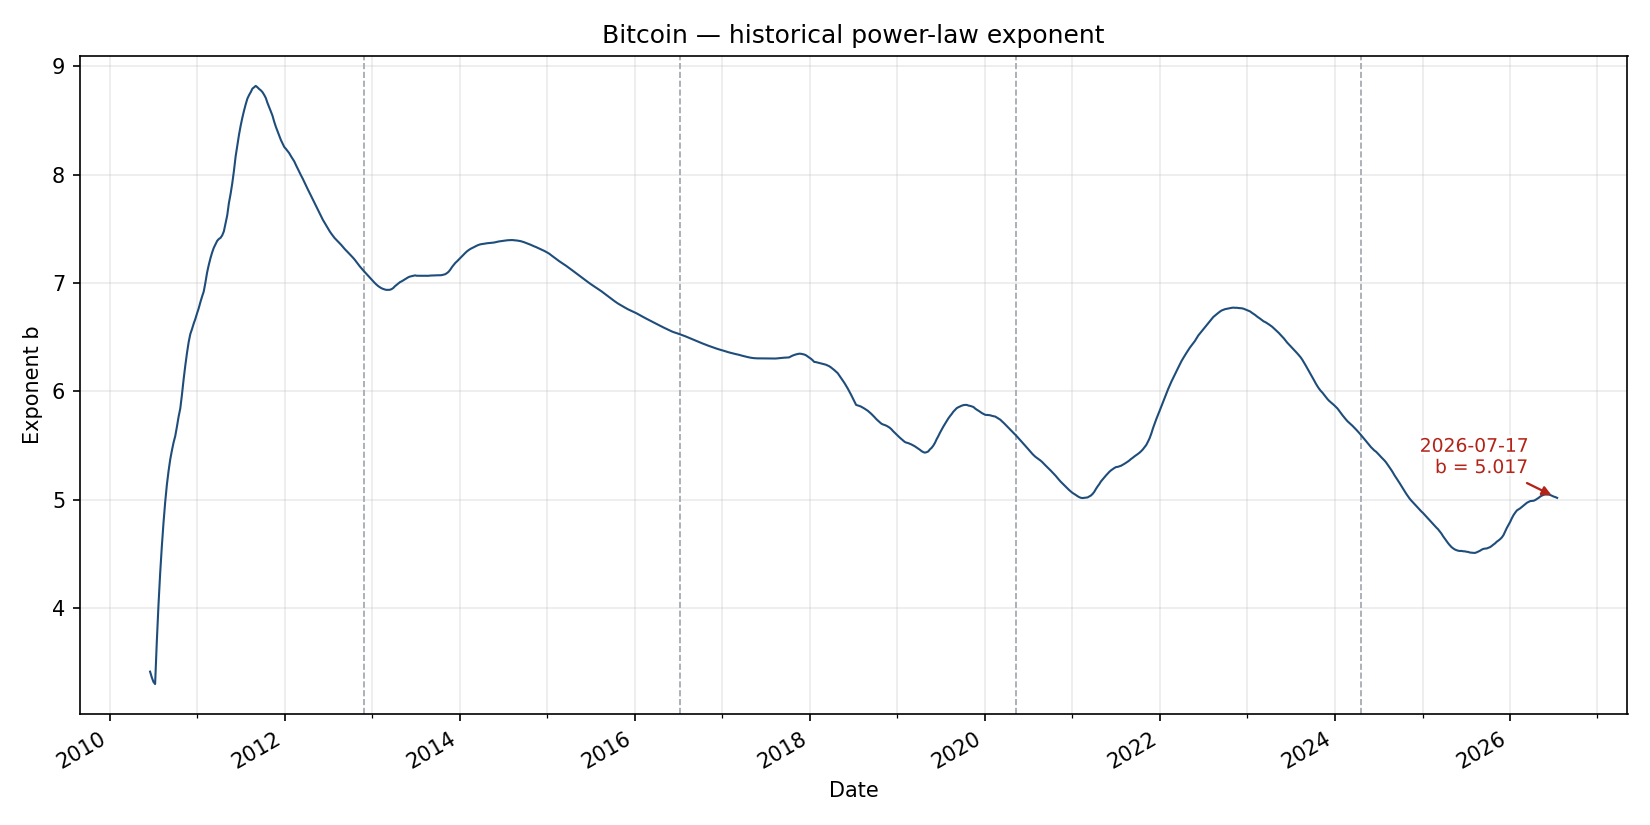
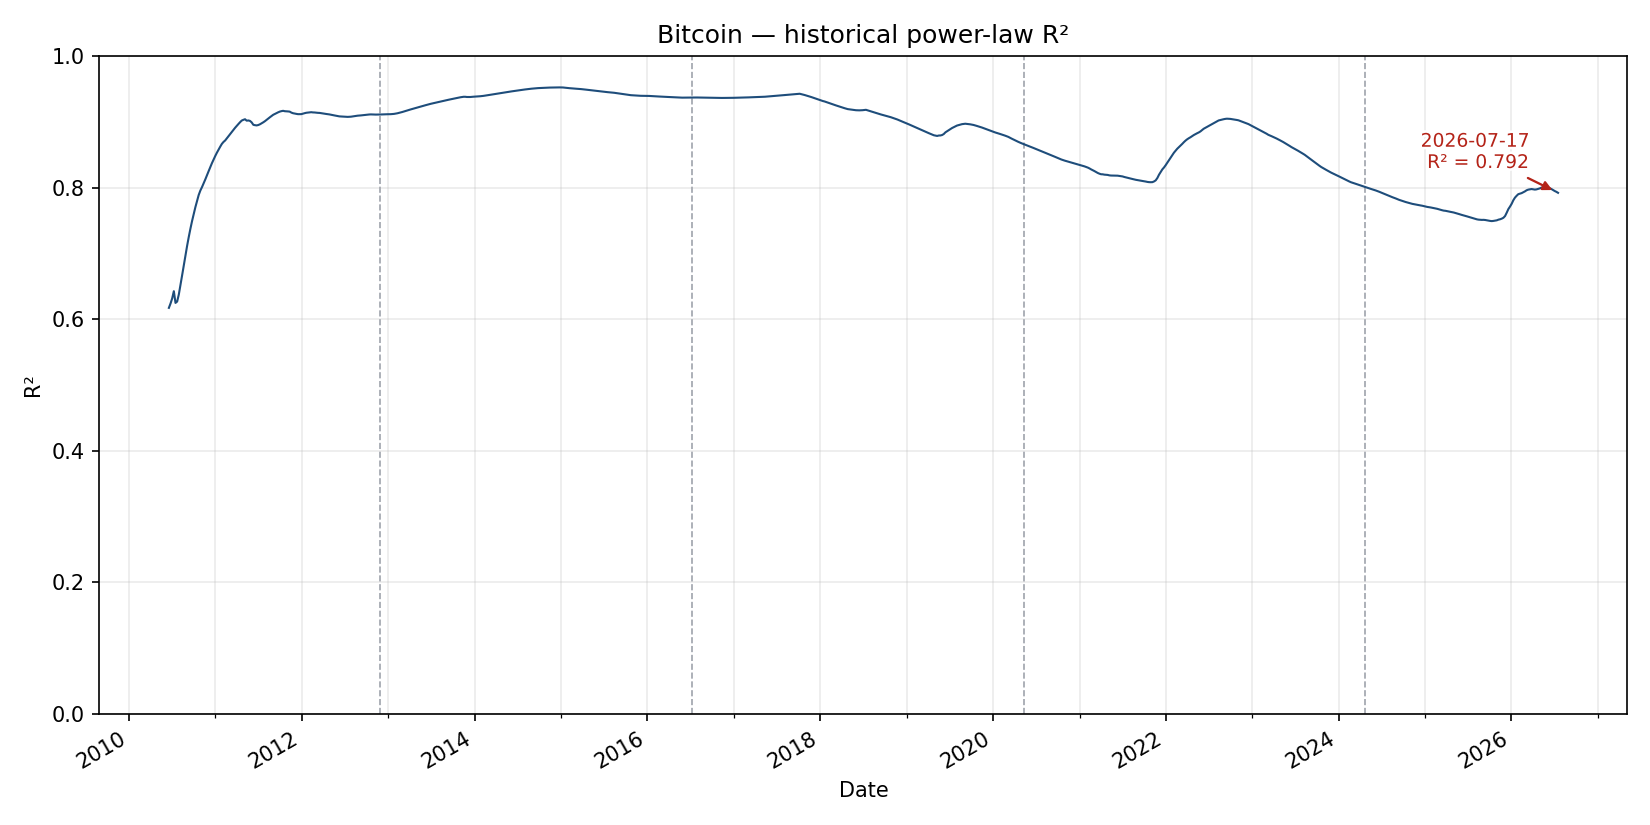
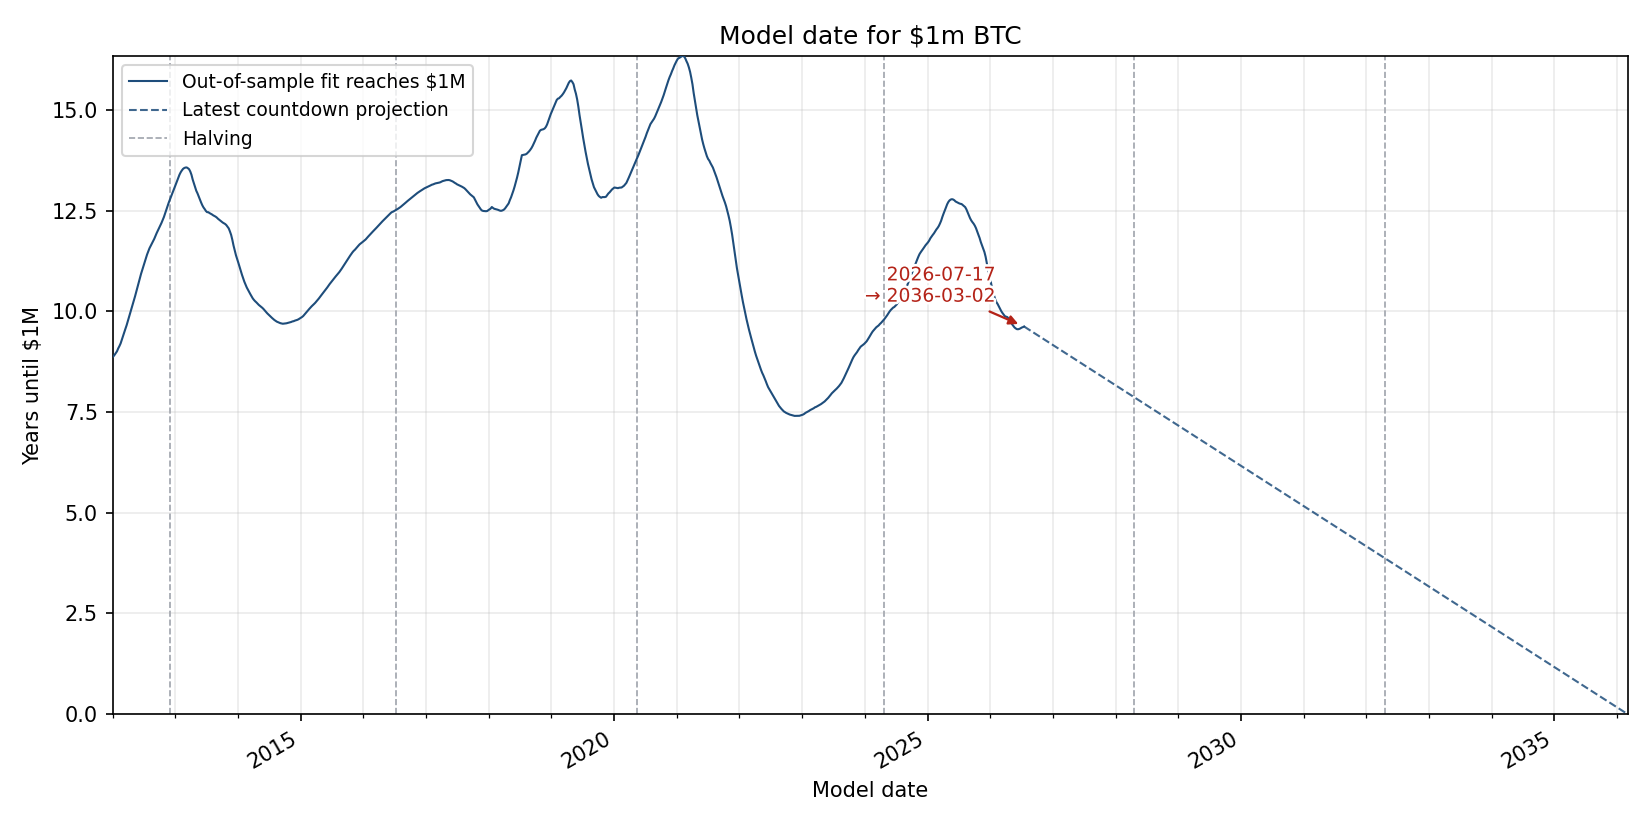
Weekly Bitcoin prices fitted to a power law price = A × tb, where t is days since the genesis block (2009-01-03). The fit uses the trailing prior 8 years of weekly prices. Both axes use log scales; the chart extends the fitted trend and band 20 years beyond the latest price. The shaded band is the 5th–95th percentile of historical actual / fitted price ratios (90% of past observations). The later charts plot that ratio over time, then show how the fitted exponent and R² have evolved across historical out-of-sample fits. The red line is the fitted trend used for the Forecasts page’s 12-year CAGR estimate. The separate Bitcoin halving cycle power law page adds the out-of-sample log-sine halving-cycle adjustment.
Loading…