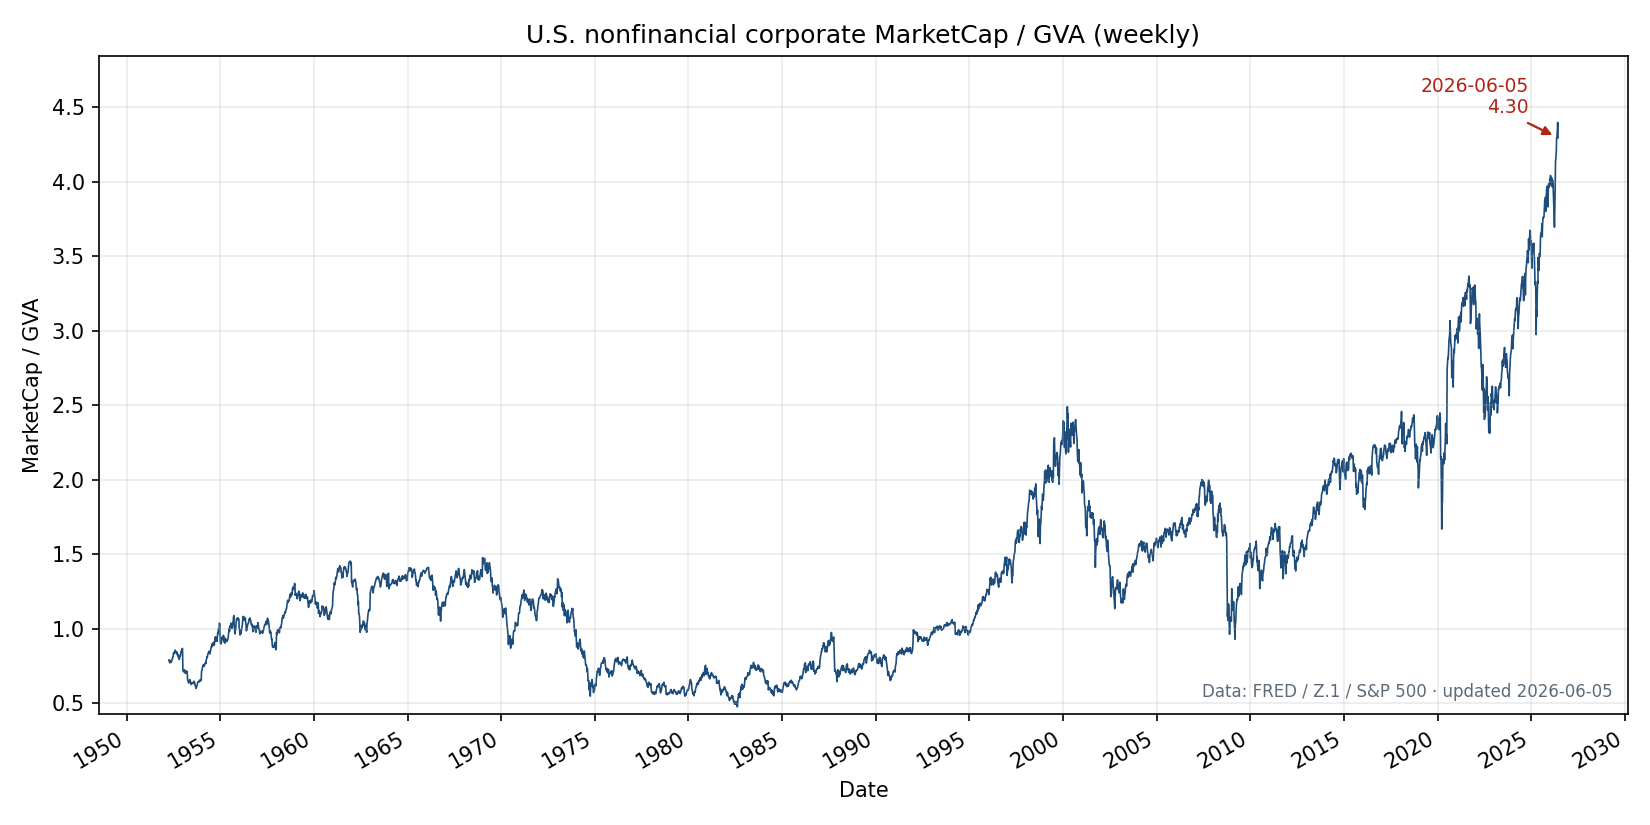
The U.S. "Nonfinancial Corporate MarketCap / Gross Value Added" indicator was introduced by John Hussman (Hussman Funds). His Knowledge Center explains the measure, its historical relationship to subsequent S&P 500 returns, and how it fits into his broader valuation framework. The charts below are an independent weekly replica built from public data.
Loading latest value…
What is MarketCap/GVA?
MarketCap/GVA is the ratio of U.S. nonfinancial corporate market capitalisation to gross value added (GVA). Hussman describes it as an economy-wide, apples-to-apples price-to-revenue multiple: the numerator and denominator both reflect the scale of nonfinancial corporate activity, unlike mixes such as market cap divided by GDP.
Gross value added is the value of output at each stage of production, counted without double-counting intermediate inputs. From the production side of the national accounts, GDP is closely related to economy-wide GVA (after taxes and subsidies). For nonfinancial corporations specifically, GVA is a smoother, more stable benchmark for long-run cash flows than a single year of earnings, which swings with profit margins over the business cycle.
Why Hussman uses it
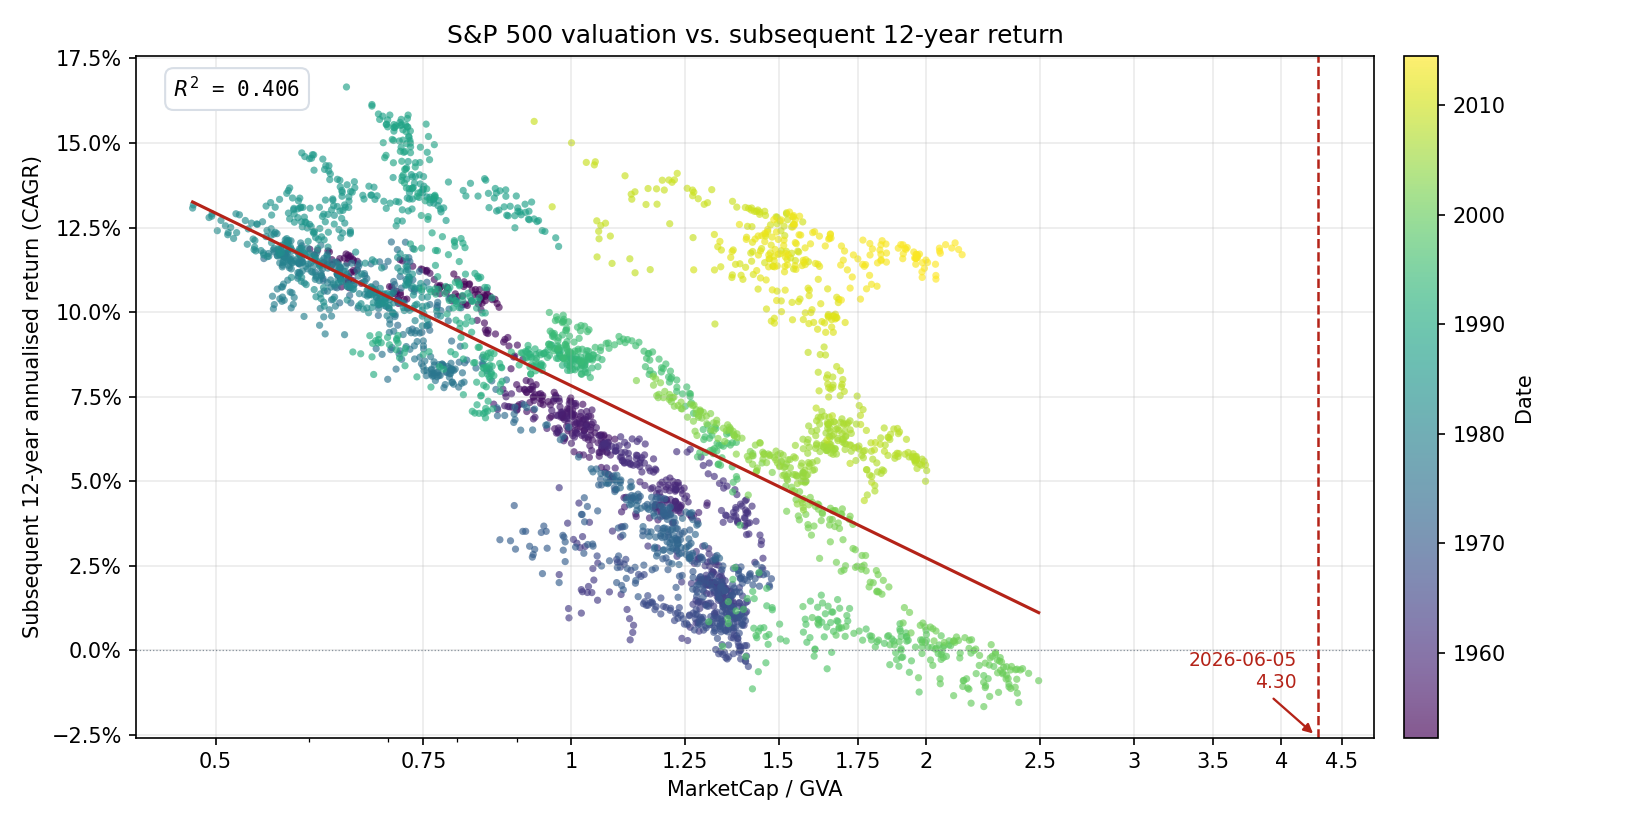
In his research, MarketCap/GVA is among the valuation measures most tightly correlated with actual subsequent S&P 500 total returns over market cycles, especially on horizons of about 10–12 years. The logic is the Iron Law of Valuation: for a given stream of expected future cash flows, a higher price today implies a lower long-term return. Paying more per dollar of corporate value added is analogous to paying a higher price-to-sales multiple for the nonfinancial corporate sector as a whole.
Hussman stresses that reliable valuations are not near-term market forecasts. An overvalued market can keep rising if investors are inclined toward speculation; severe losses more often follow when rich valuations coincide with deteriorating market internals and risk-aversion. MarketCap/GVA is meant to inform long-horizon return expectations, not week-to-week timing.
Further context, scatter plots vs. subsequent returns, and related measures are on the Hussman Funds Knowledge Center under Nonfinancial Market Capitalisation to Gross Value-Added (MarketCap/GVA). The measure was first presented in his May 2015 market comment.
How this chart is built
Denominator (national GVA): Domestic nonfinancial GVA from the Fed Z.1 Financial Accounts, scaled up to approximate national activity using a 5-year average of NIPA rest-of-world vs. domestic nonfinancial profits (foreign-adjusted GVA). This figure updates when Z.1 / NIPA data are released (~quarterly) and is held constant between releases.
Numerator (market cap): Nonfinancial corporate equity market value from Z.1 at each quarter-end. Between releases, cap is scaled by the cumulative S&P 500 index from weekly returns, matching the intra-quarter update approach described in Hussman’s methodology notes.
Sources: FRED (Z.1, NIPA).
How to read the line
Higher readings mean investors are paying more per dollar of nonfinancial corporate value added. Historically, very elevated levels have been associated with weak average stock returns over the following decade-plus.
Most short-term movement in this weekly series reflects the market-cap leg (equity prices). The GVA leg steps only when new fundamentals are published.